Task Testing
Part of AI presentation tools
Testing whether a presentation tool preserves figures
AI presentation tools can make a number look convincing even when they copied it incorrectly or dropped its qualification. Test data fidelity separately from visual appeal.
AI presentation tools can make a wrong number look convincing, or hide a dropped qualifier. Test data fidelity separately from visual appeal.
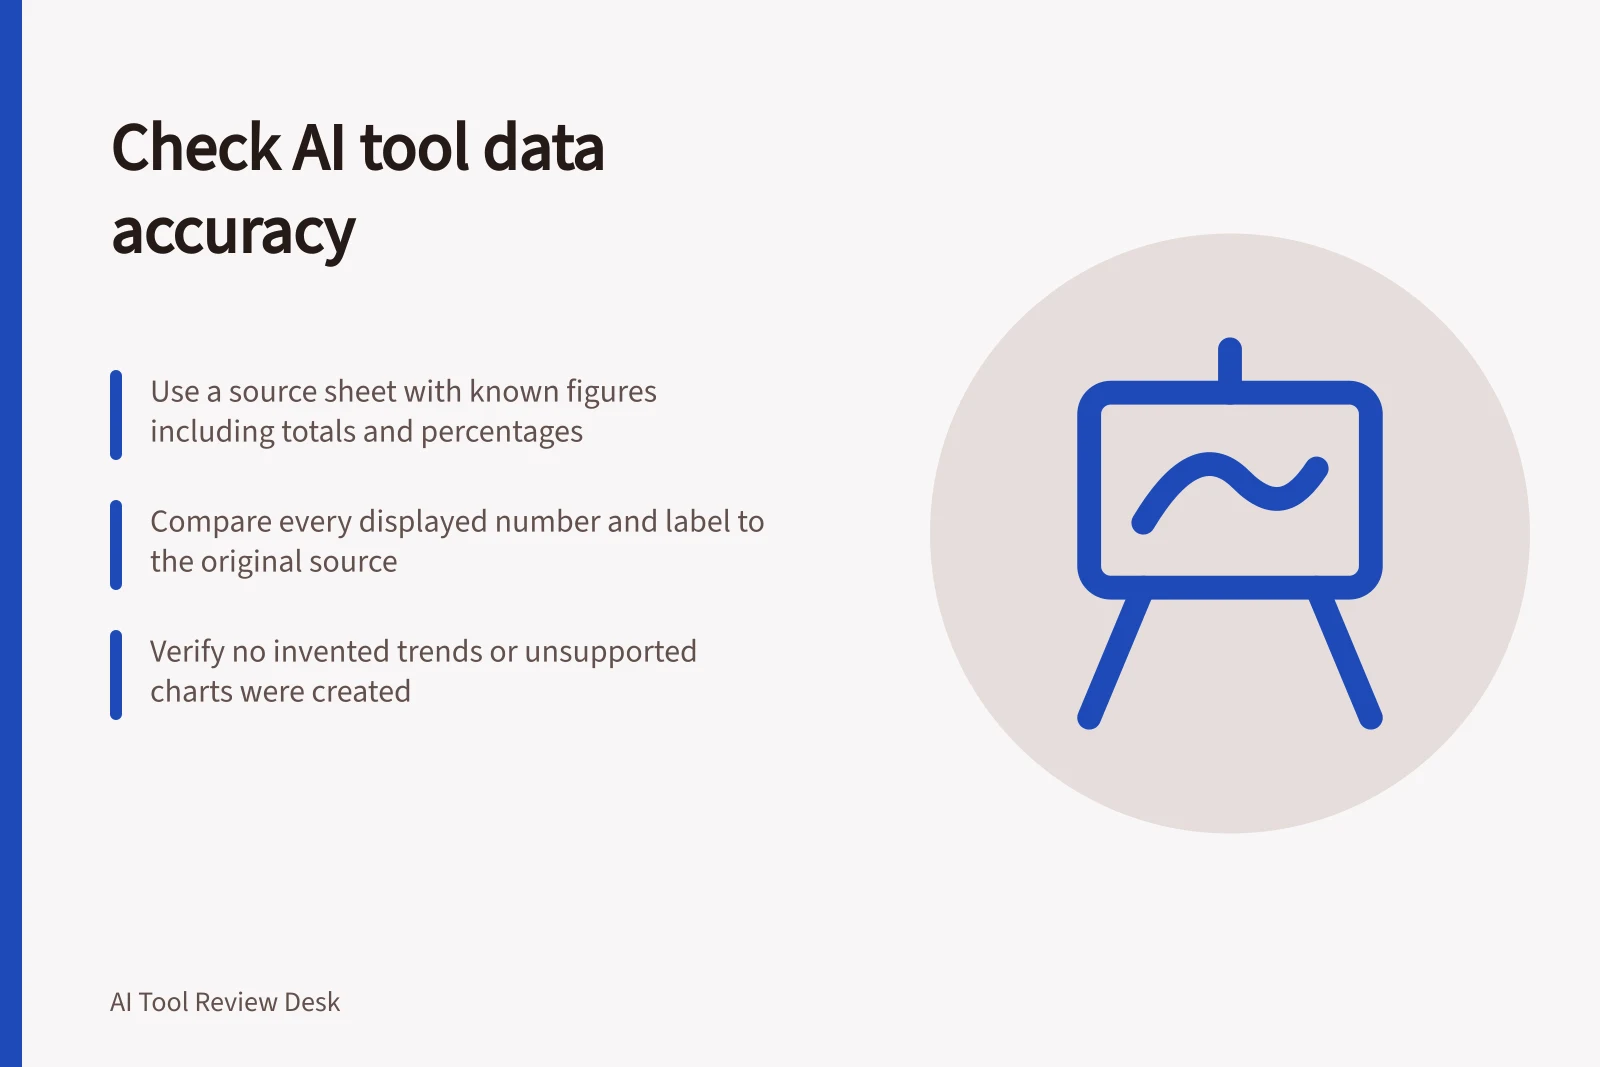
Use a source sheet with a few known figures: a total, a percentage with a denominator, a date, a unit and a chart with a clear axis. Add a caveat such as “preliminary” or “excludes refunds”.
Ask the tool to build a short deck. Compare every displayed number and label with the source. Check whether it invented a trend between two points or replaced a table with an unsupported chart.
Do not infer source accuracy from a feature that can reference a file. Keep a human reviewer responsible for the figure, and place the source date and definition where the audience can understand them.
Repeat the check after export and after an edit. Reflow can separate a footnote from its figure; manual revisions can leave an old number on another slide. Score the tool by correction effort and traceability, not just how many slides it produced.
Data Handling Capabilities of Popular AI Presentation Tools
- Microsoft PowerPoint with CopilotCan import slides from files; preserves formatting but may omit qualifiers. Refer to: https://support.microsoft.com/en-us/powerpoint/copilot/add-a-slide-from-a-file-with-copilot-in-powerpoint
- Canva Magic DesignGenerates designs from text prompts; supports download in multiple formats. Check file type compatibility: https://www.canva.com/help/download-file-types/